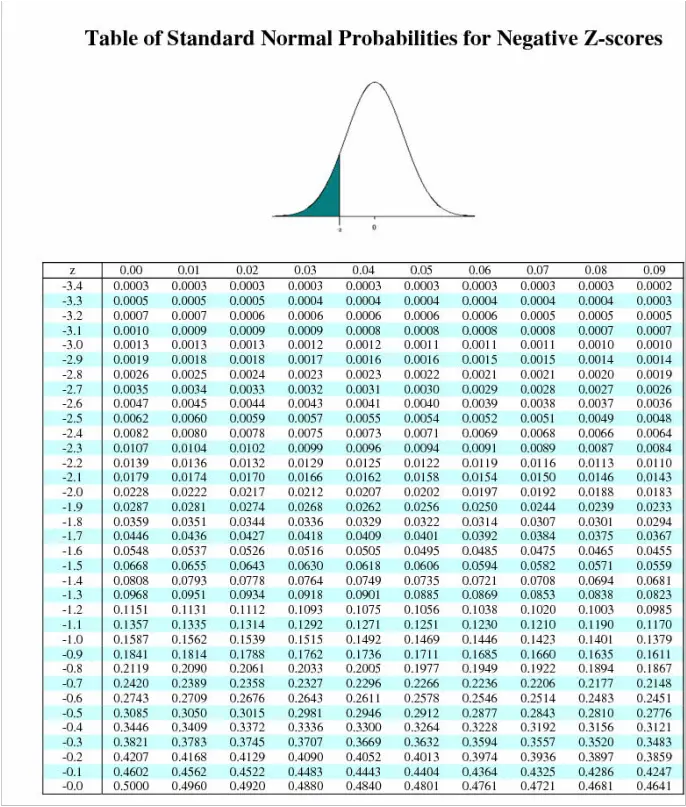
Negative Z Score Table
Find negative Z scores in this table and use our Z Score Calculator.
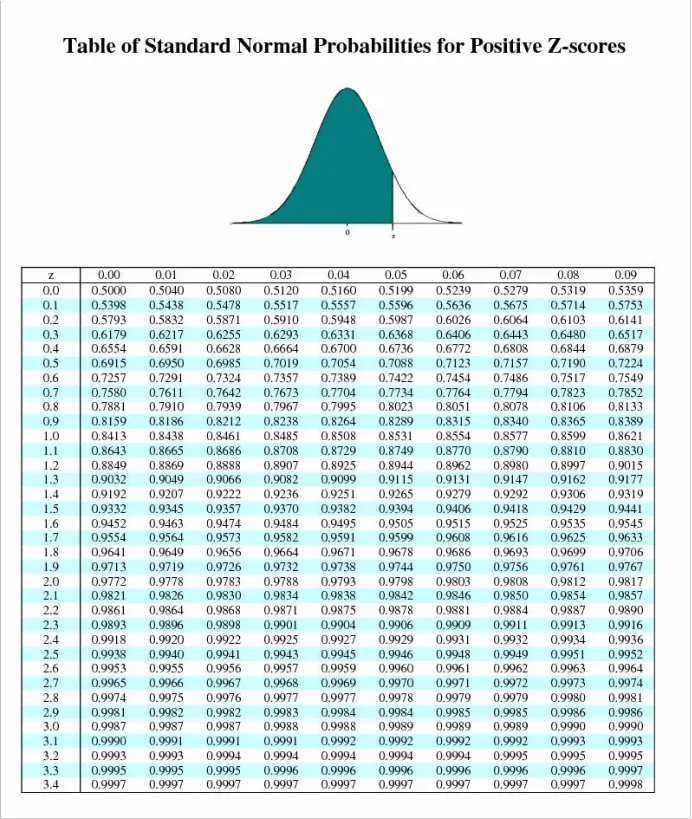
Positive Z Score Table
Find positive Z scores in this table
Z Score Table: A Comprehensive Guide to Understanding and Using Negative and Positive Z Scores
In the realm of statistics, Z scores play a crucial role in determining the probability associated with specific observations or data points in a standard normal distribution. In this comprehensive article, we will delve into the details of Z scores, explain how to calculate them, and explore how to utilize both negative and positive Z score tables to find probabilities under the curve. Whether you're a student, researcher, or data analyst, this guide will provide you with a thorough understanding of Z scores and their practical applications.
Understanding Z Scores
To comprehend Z scores, let's first define them:
Z Score: A Z score, also known as a standard score, measures the number of standard deviations an observation or data point is from the mean of a distribution. It allows us to compare and interpret individual data points relative to the average and variability of a dataset.
A Z score is calculated using the formula:
Z score = (observation - population mean) / population standard deviation
The resulting Z score indicates the position of the observation within the distribution. A positive Z score indicates that the observation is above the mean, while a negative Z score indicates that the observation is below the mean. The magnitude of the Z score represents the distance from the mean in terms of standard deviations.
The Z Score Table
The Z score table, also known as the standard normal distribution table or the Z table, is a precalculated table that provides the probabilities associated with various Z scores. It enables us to determine the proportion of data points that fall within a specific range or the probability of observing a value within a certain threshold.
The Z table is divided into two sections: the negative Z score table and the positive Z score table. These tables provide the area under the curve to the left of a given Z score, representing the cumulative probability.
The Z table is divided into two sections: the negative Z score table and the positive Z score table. These tables provide the area under the curve to the left of a given Z score, representing the cumulative probability.
Using the Negative Z Score Table
The negative Z score table is used when dealing with Z scores that are less than zero, corresponding to observations below the mean of the distribution. To utilize the negative Z score table, follow these steps:
- Identify the desired Z score. For example, let's assume we have a Z score of -1.50.
- Locate the whole number part of the Z score in the leftmost column of the table. In our example, this would be -1.5.
- Identify the decimal part of the Z score in the top row of the table. In our case, this would be 0.00.
- Find the corresponding value at the intersection of the whole number and decimal parts. In our example, the value is 0.0668.
- Interpret the value obtained as the proportion of data points with Z scores less than the given Z score. In our case, approximately 6.68% of the data falls below a Z score of -1.50.
Using the Positive Z Score Table
The positive Z score table is used when working with Z scores greater than zero, corresponding to observations above the mean of the distribution. To utilize the positive Z score table, follow these steps:
- Identify the desired Z score. Let's consider a Z score of 1.80 for our example.
- Locate the whole number part of the Z score in the leftmost column of the table. In our case, this is 1.8.
- Identify the decimal part of the Z score in the top row of the table. In our example, the decimal part is 0.00.
- Find the corresponding value at the intersection of the whole number and decimal parts. In our case, the value is 0.9641.
- Interpret the value obtained as the proportion of data points with Z scores less than the given Z score. For a Z score of 1.80, approximately 96.41% of the data falls below that value.
Practical Examples
To solidify our understanding, let's consider a few practical examples:
Understanding Z scores and utilizing the Z score table empowers us to analyze and interpret data within a standard normal distribution. Whether we are calculating probabilities, finding cut-off points, or determining proportions, the Z score table provides a valuable resource for statistical analysis. By following the steps outlined in this guide and applying the concepts through practical examples, you can confidently navigate the world of Z scores and harness their power in various fields such as research, data analysis, and decision-making.
- Example 1 - Probability Calculation: Suppose we have a dataset with a normally distributed variable. We want to find the probability of observing a value less than a Z score of -1.25. Using the negative Z score table, we locate the corresponding value, which is 0.1056. This means that approximately 10.56% of the data falls below a Z score of -1.25.
- Example 2 - Finding the Cut-off Point: Imagine we are conducting a study and want to determine the cut-off point that includes the top 5% of the data. By using the positive Z score table, we find that a Z score of approximately 1.65 corresponds to a cumulative probability of 0.9505. Therefore, the cut-off point would be around 1.65 standard deviations above the mean.
- Example 3 - Proportion Calculation: Let's consider a scenario where we want to find the proportion of data points falling between two Z scores. Suppose we have Z scores of -0.75 and 1.25. Using the negative Z score table, we find that the proportion below -0.75 is approximately 23.97%. Using the positive Z score table, we find that the proportion below 1.25 is approximately 89.43%. By subtracting the two proportions, we can conclude that approximately 65.46% of the data falls between -0.75 and 1.25.
Understanding Z scores and utilizing the Z score table empowers us to analyze and interpret data within a standard normal distribution. Whether we are calculating probabilities, finding cut-off points, or determining proportions, the Z score table provides a valuable resource for statistical analysis. By following the steps outlined in this guide and applying the concepts through practical examples, you can confidently navigate the world of Z scores and harness their power in various fields such as research, data analysis, and decision-making.

